Follow DemLabs on our NEW social media!
Cruel & unusual punishment: South Carolina’s racist executions
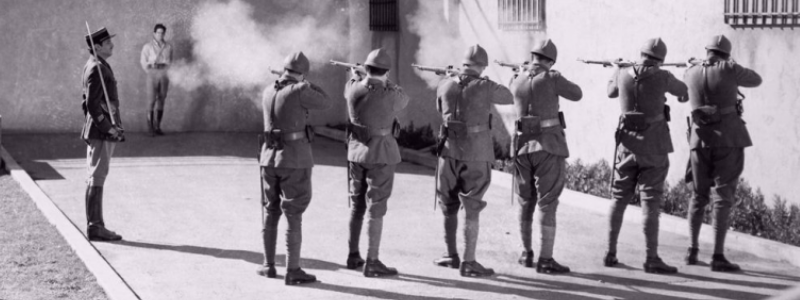
“New death penalty law makes inmates pick electric chair or firing squad in South Carolina.” – CBS
Nineteen of the 37 inmates currently on the state’s death row are Black. “In the midst of a national reckoning around systemic racism, our Governor ensured that South Carolina’s death penalty — a system rooted in racial terror and lynchings — is maintained,” said Frank Knaack, executive director of the SC chapter of the American Civil Liberties Union.
What’s driving such cruel & unusual punishment? Is there a pattern between lynchings of Black victims after the Civil War and current Republican incarceration and execution policies? Where does South Carolina rank in the civilized world in terms of incarcerations? How many of SC inmates are Black as compared to their percentage of the population? What can people do to bring about a criminal justice system that’s fair to all?
This DemLabs StoryMap answers these questions with data from The Prison Policy Institute, The VERA Institute of Justice and the Death Policy Information Center.
Designing this StoryMap
DemLabs created this digital story was with the free StoryMaps app. It can be skimmed in less than a minute or researched closely on either a phone or laptop. It includes seven infographics, maps, four videos and numerous links to more resources.
The StoryMap can be freely shared with this URL https://arcg.is/LG45T or embedded in a website with this code:
< iframe src=”https://storymaps.arcgis.com/stories/0edd2c78de924e99a4e3011560fcb6fb” width=”100%” height=”500px” frameborder=”0″ allowfullscreen allow=”geolocation”>
Racist incarcerations and executions
1. Start with the background. “The death penalty is the direct descendant of slavery, lynching, and Jim Crow-segregation. With the continuing police and white vigilante killings of Black citizens, it is important understand the outsized role the death penalty plays as an agent and validator of racial discrimination.” – Death Penalty Information Center
2. Keep it simple. There are 2.3 million people are locked up in more than 6,000 correctional facilities operated by thousands of agencies according to the PPI. That’s a lot of information for anyone to digest. We chose three charts with details on South Carolina’s incarceration rate, what percentage of its inmates were Black and details on a typical county. There are a mind-boggling 471 inmates for every 100,000 residents in predominantly Black Florence County, SC.
3. Make it interactive. We wanted to let readers see for themselves the patterns between Lynchings of Black Victims (1883-1940) and Executions of Black Defendants (1972-2020)
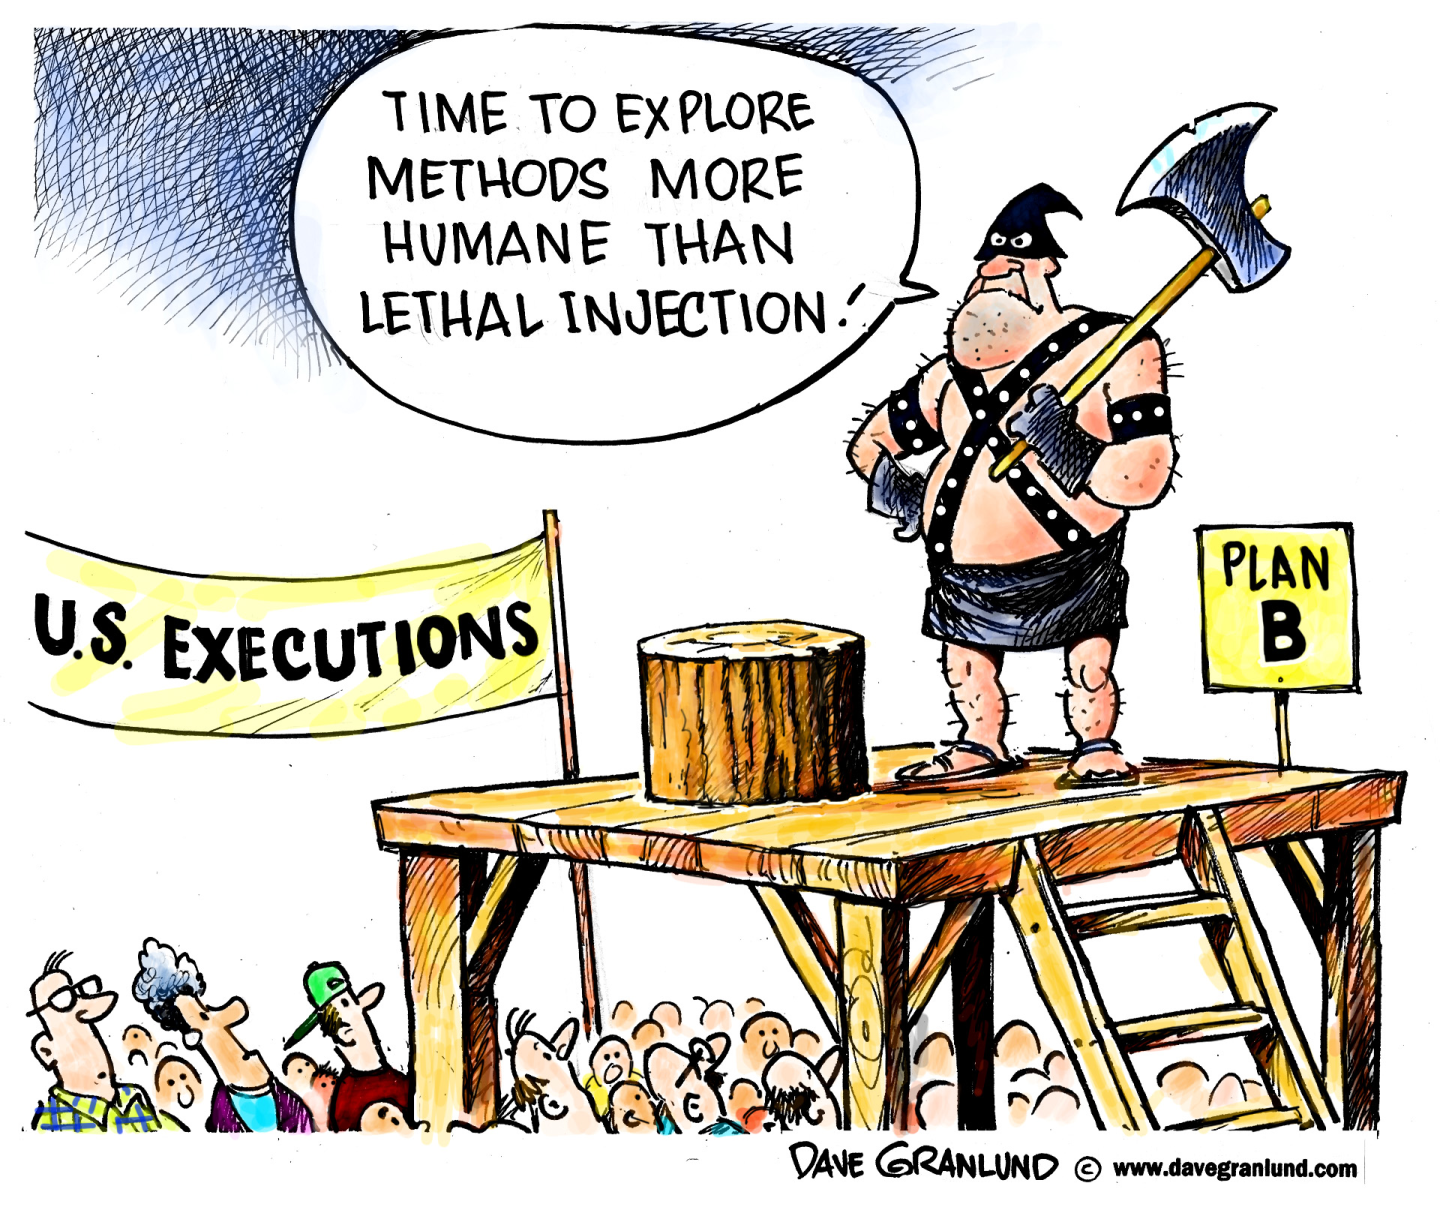
4. Make it visual. We included a number of videos in the StoryMap to emphasize the systemic racism in the criminal justice system, including this one from the VERA Institute of Justice. An editorial cartoon from Political Cartoons is also included in the StoryMap.
5. A call to action. The StoryMap includes links for more information and donation links to The Prison Policy Institute, The VERA Institute of Justice and the Death Policy Information Center. There is link that encourages readers to register to vote in order to “Change racist execution policies. Register to vote and elect candidates aligned with your values.”
TakeAway: ‘A well informed citizenry is the best defense against tyranny’ – Thomas Jefferson.
Use a StoryMap to present the facts, make them understandable and include a call to action.
Deepak
DemLabs
Image credit: Truth Uncensored


