

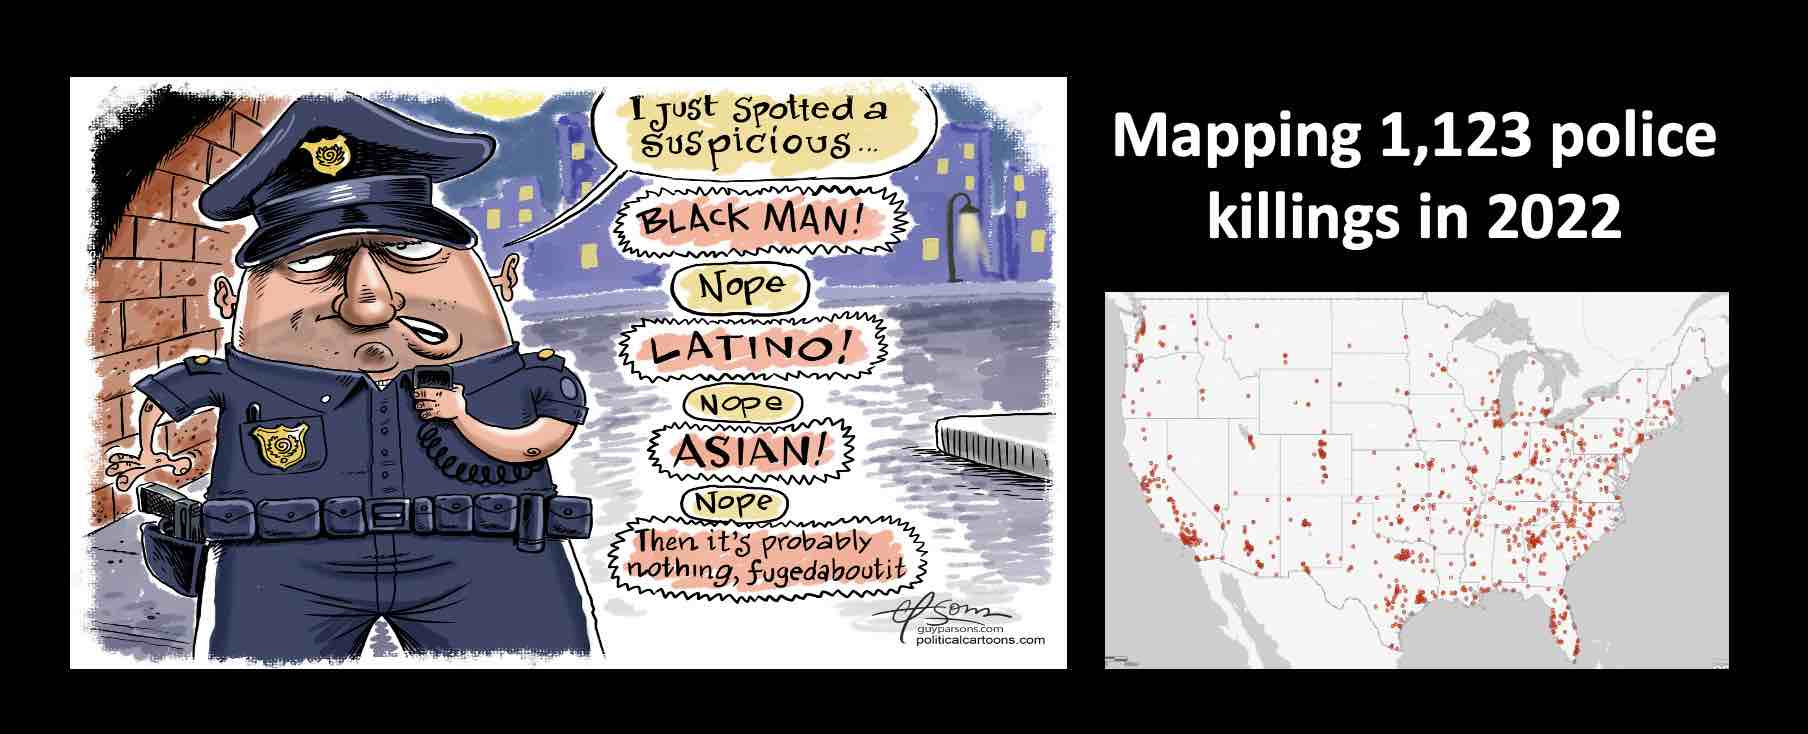
Police killings from 2022 mapped: Spot the pattern?
Killings by US police reach record high in 2022 – The Guardian
1,123 people died in police killings in 2022. That’s about three people every day!
We analyzed where these killings took place. What was the race of the victim and the police officer? What was the level of poverty in the community? Who is the political rep for that area? Was there a connection?
We used ArcGIS Online for this analysis with data on 1,123 Police Killings and background information from Washington Post , Henry Wallace Police Crime Database, Mapping Police Violence and The Guardian. You contrast the 417 White Americans killed by the police killing versus 706 Americans of color, even though they are a much smaller percentage of the total population. is shown in two forms:
- Police Killings app that lets you get all the data quickly
- Police Killings StoryMap which provides context to the numbers.
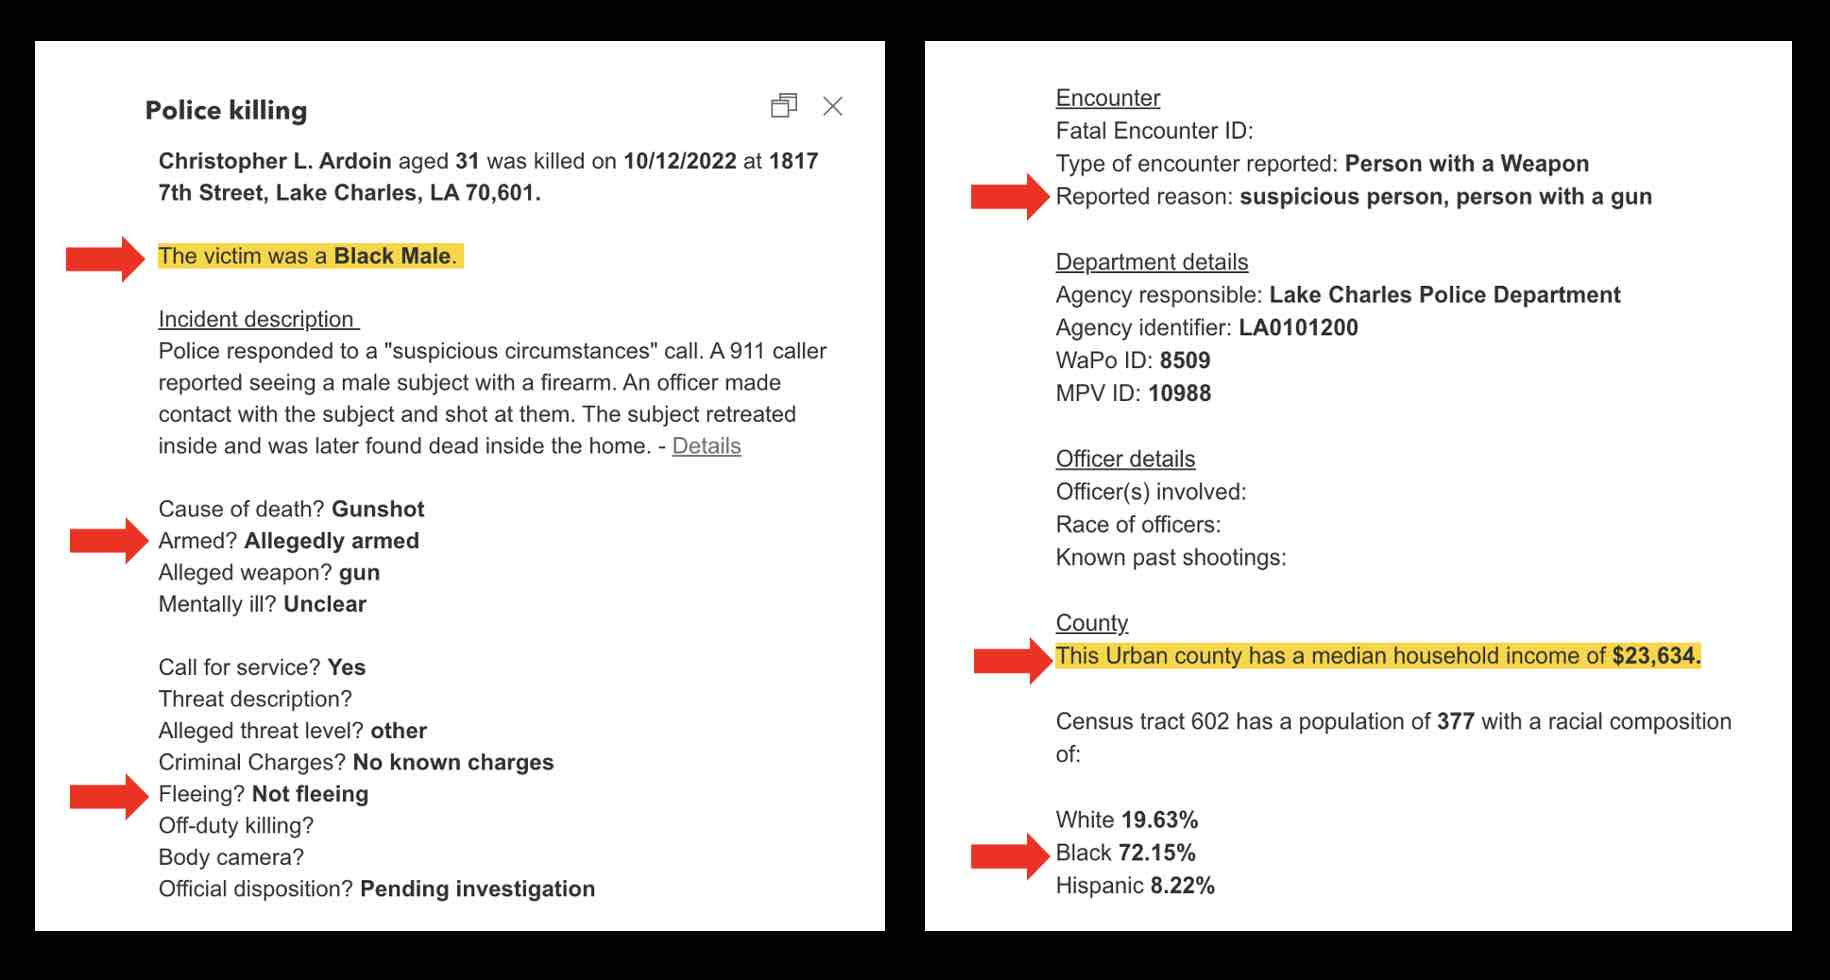
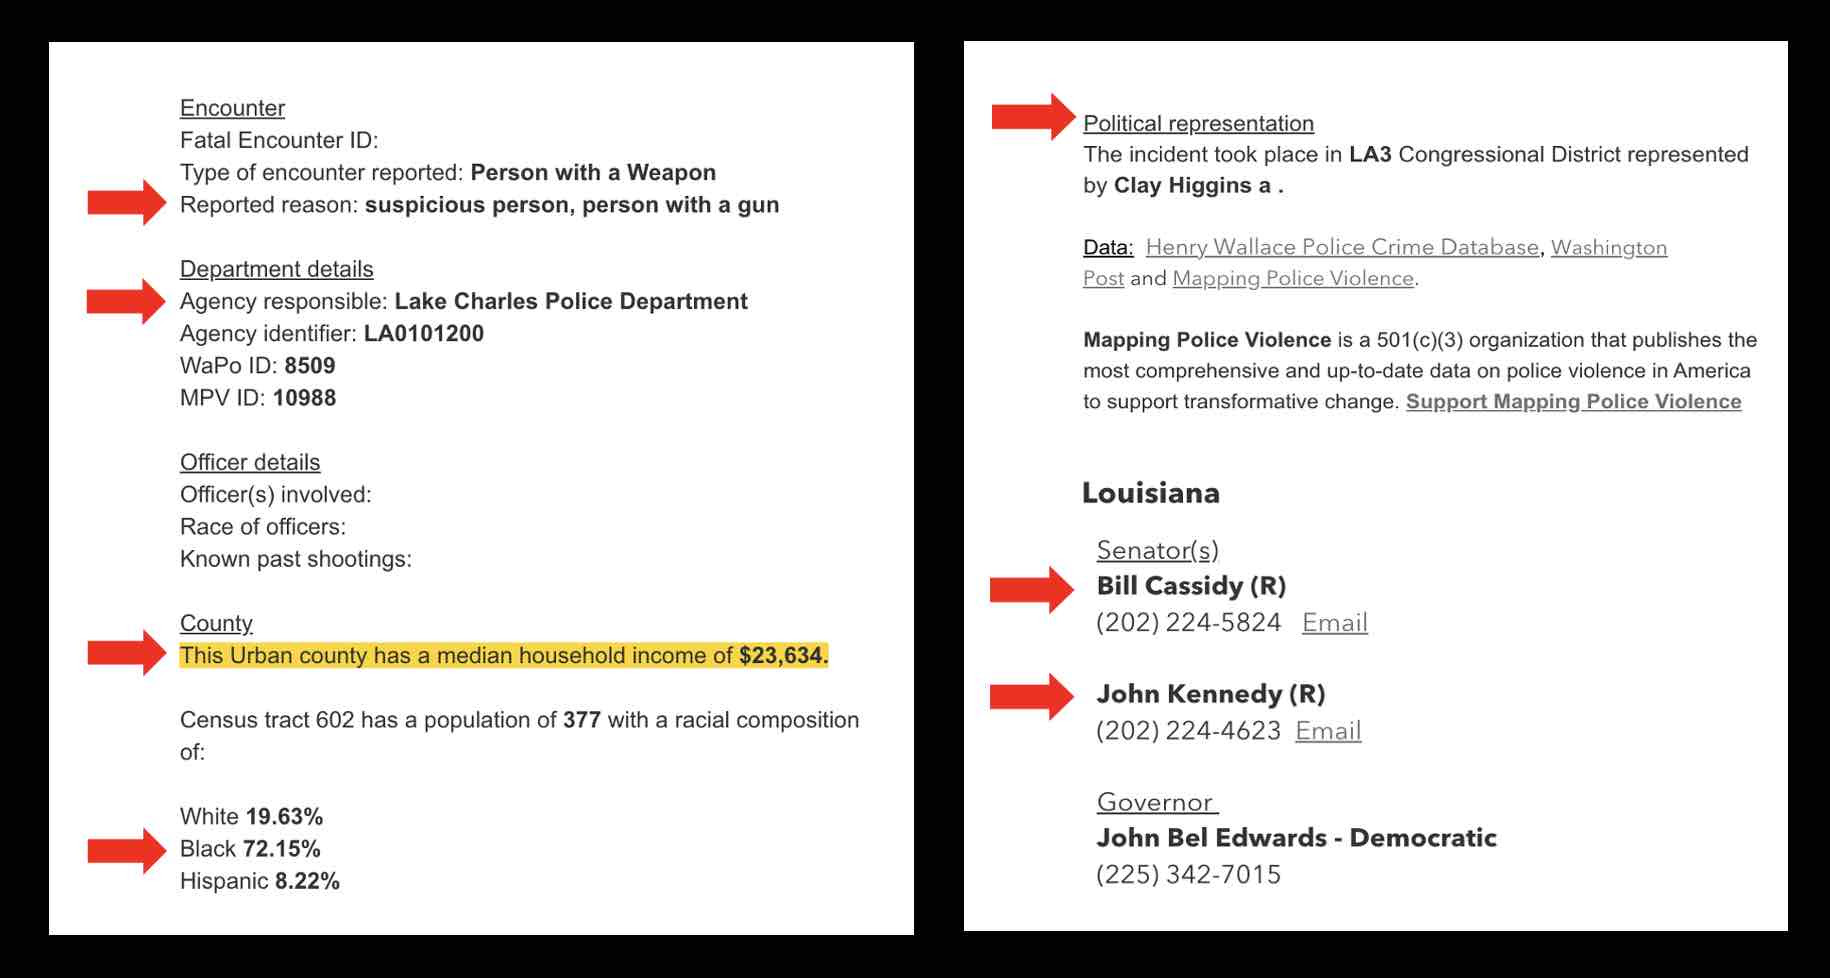
Clicking on any dot reveals details of the killing. The race, age and other characteristics of the victim and the community they live in. Look at the clusters of deaths and see if you can spot any pattern? Why is that? Judge for yourself.
Mapping Police Killings in 2022 app
Make sense of data with maps
This map includes a SPLASH SCREEN with a brief introduction to the killings. The map consists of three layers – all the killings, killings of white Americans and another layer with incidents of Americans of color. You can toggle which map layers to see. The app can be used on a phone, tablet or laptop.
The map can be freely embedded in a website with this code: < iframe width=”800″ height=”600″ frameborder=”0″ scrolling=”no” allowfullscreen src=”https://arcg.is/T0e4C”></iframe>
Add context to data
This StoryMap is designed on the same map but opens with a short video clip to illustrate a police killing of the tragic killing of Walter Scott in South Carolina. The map is presented as a map and in the form of a SLIDER which shows police killings of White and Colored Americans side-by-side. Background information and links to more resources are included in the map.
A lot of details on each incident are included in the map, but the complexity is hidden through the map interface. This makes the data easier to navigate, search and understand. Details of the police killing incident are overlaid with additional details such as:
- The racial composition and the median income in the community
- The local police department
- The congressional rep, senator and governor for the area
Merging the different types of data helps provide a fuller view of the scourge of police killings so the reader can make their own judgement with all the information.
Police killings analyzed
Although half of the people shot and killed by police are White, Black Americans are shot at a disproportionate rate. They account for roughly 14 percent of the U.S. population and are killed by police at more than twice the rate of White Americans. Hispanic Americans are also killed by police at a disproportionate rate.
Most victims are young. More than half of people shot and killed by police are between 20 and 40 years old. An overwhelming majority (over 95%) of the victims are male. – Washington Post
Resources
TakeAway: Vote for responsible politicians to curb police killings and reform the justice system. Your life may just depend on it!
Deepak
DemLabs
DISCLAIMER: ALTHOUGH THE DATA FOUND IN THIS BLOG AND INFOGRAPHIC HAS BEEN PRODUCED AND PROCESSED FROM SOURCES BELIEVED TO BE RELIABLE, NO WARRANTY EXPRESSED OR IMPLIED CAN BE MADE REGARDING THE ACCURACY, COMPLETENESS, LEGALITY OR RELIABILITY OF ANY SUCH INFORMATION. THIS DISCLAIMER APPLIES TO ANY USES OF THE INFORMATION WHETHER ISOLATED OR AGGREGATE USES THEREOF.
Reposted from Democracy Labs with permission.


