


Casualty map from Republican scheme to kill Social Security


The Republican 11 Point Plan calls for ending Social Security.
How many seniors would suffer in their scheme? How many are disabled? Widowed? Where do they live? How much does the program cost? Who are the Senators pushing for these cuts? We mapped the devastation this Republican plan would cause using ArcGIS and data from the Social Security Administration (SSA).
Mapping the casualties from Republican plan to kill Social Security


Republican plan to kill Social Security
“Senator Ron Johnson wants Social Security and Medicare on the chopping block every year,” Biden wrote. “He’s the same guy who said if Republicans get control of Congress, they’ll try to get rid of the [Affordable Care Act] again — denying insurance to people with preexisting conditions. These guys never stop.”
Johnson said on a radio show this month that Social Security and Medicare shouldn’t be “mandatory” programs and should be subject to yearly renewal decisions in Congress. Johnson’s comments are in line with the GOP Platform “An 11-Point Plan to Rescue America,”. Mandela Barnes, Johnson’s Democratic opponent, accused him of “want[ing] to strip seniors of the benefits they’ve worked their entire lives for.” – Market Realist

Millions of seniors depend on Social Security
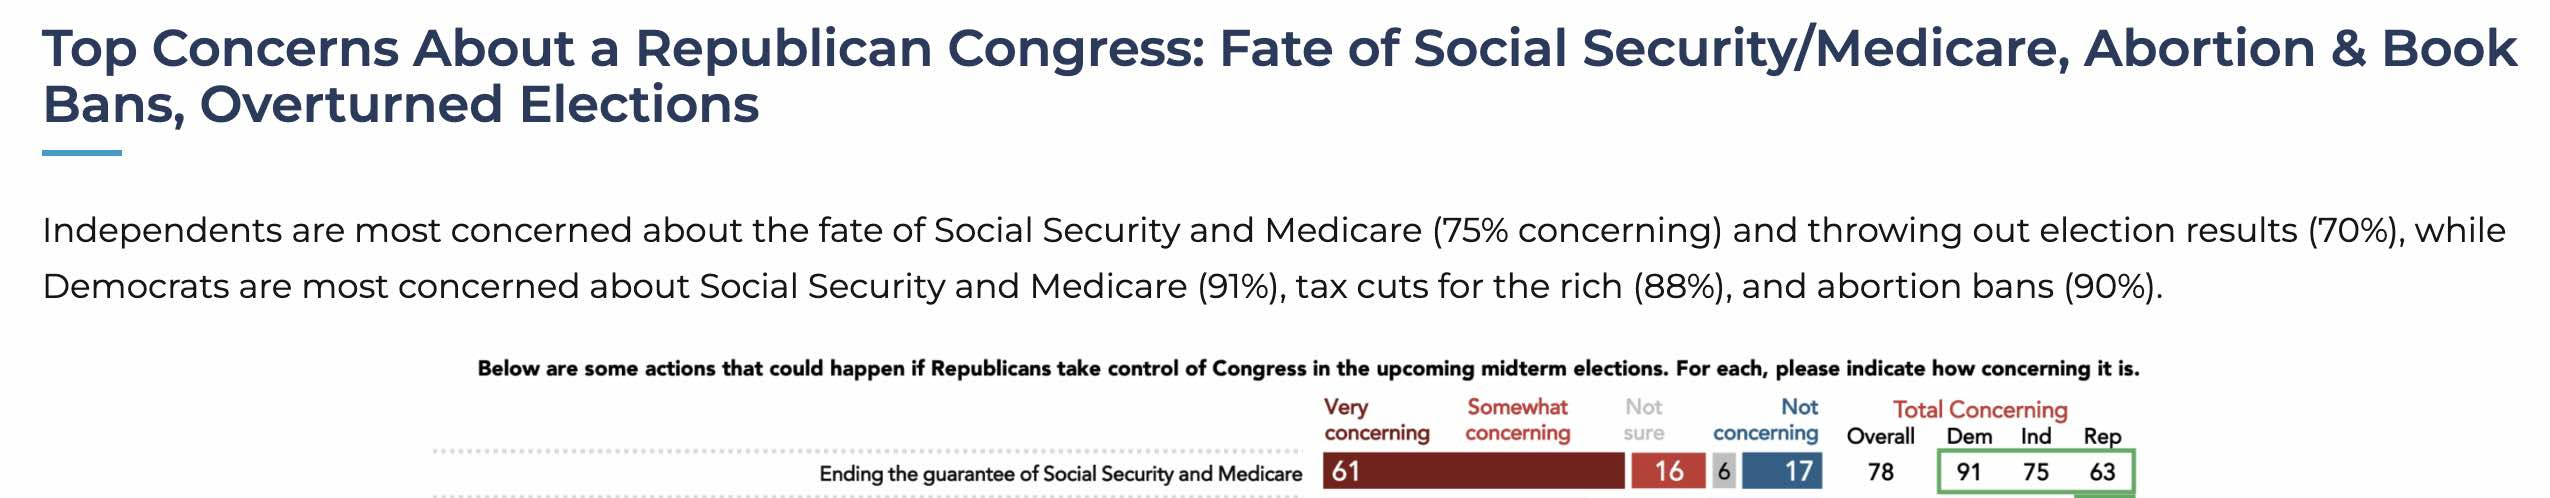
The most concerning frames about Republican elected officials focus on their desire to cut education, Medicare, and Social Security; their desire to ban abortions without exceptions; and their failure to look out for people who work for a living, all of which are seen as some of the truest of the frames tested. Independents are most concerned about the fate of Social Security and Medicare (75% concerning) and throwing out election results (70%), while Democrats are most concerned about Social Security and Medicare (91%), tax cuts for the rich (88%), and abortion bans (90%). – Navigator Research
Make the facts easier to understand with a StoryMap


Republicans hope you won’t pay attention to their scheme
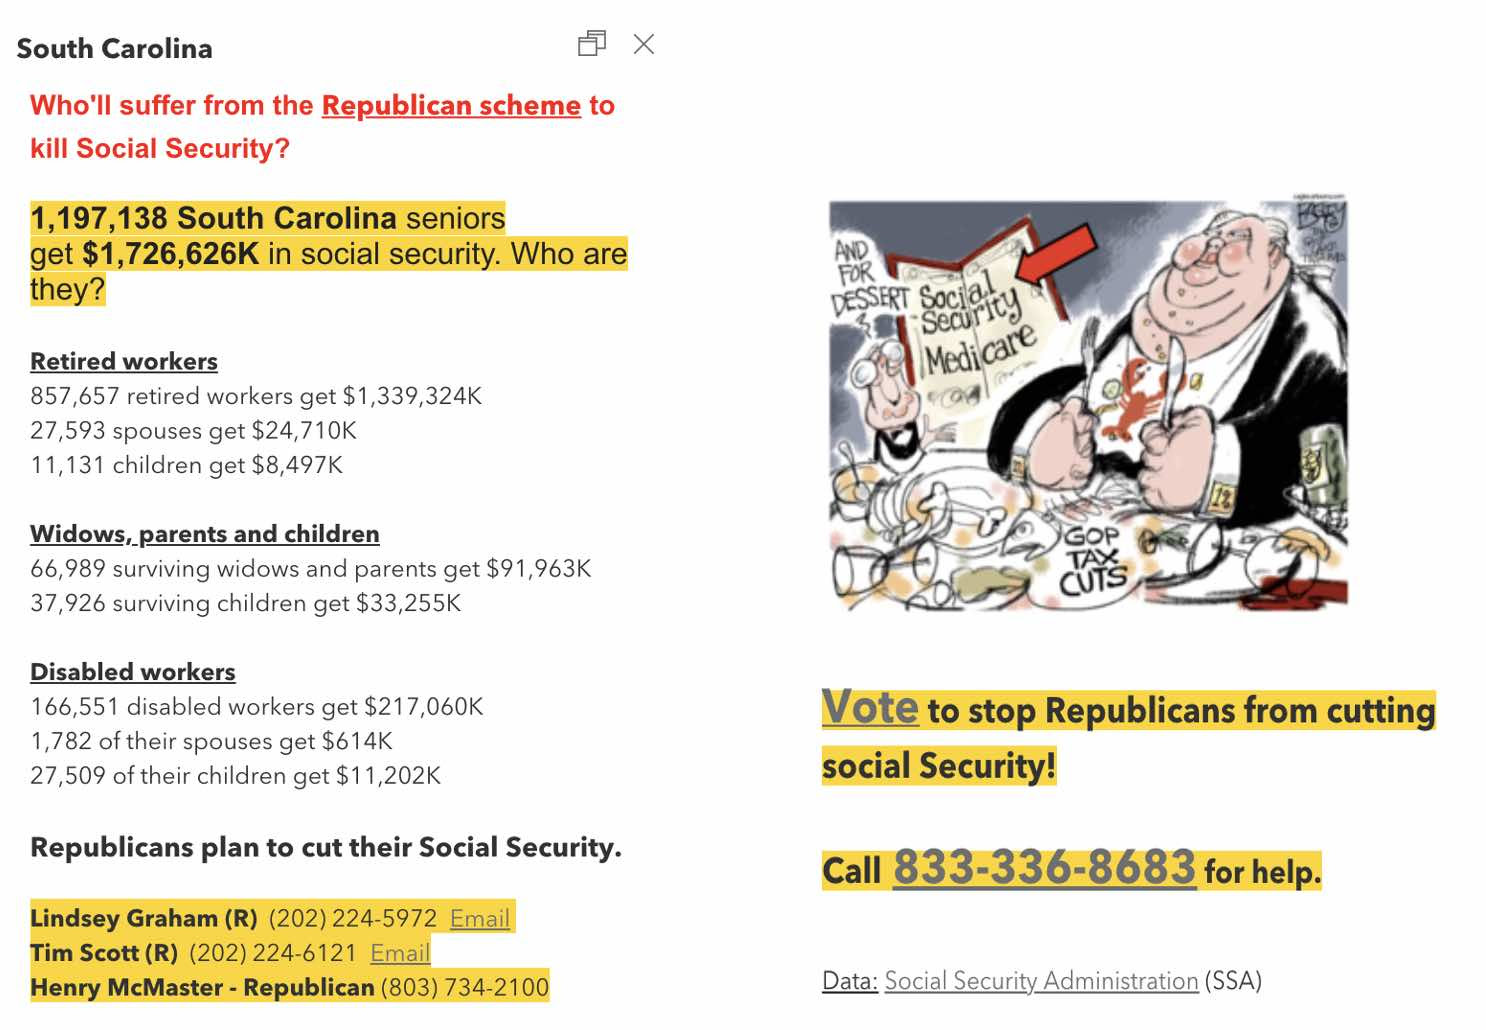
Republicans count on voters being busy or distracted to pay attention to what they’re up to. The facts are often hard to find online and even harder to understand. This map, for instance uses data from three different tables on the Social Security Administration website. How do you make all this information understandable?
We mapped the data with ArcGIS Online so a reader can see how many people in their state get Social Security and would be hurt if the Republican plan succeeds. It also shows how many of the beneficiaries are disabled and widowed. Contact details on the Senators who are supposed to be representing their interests is also included. There is a call to action to vote in order to stop Republicans from killing Social Security.
Use interactive maps

Facts are dry. Stories make them interesting.
Facts can be boring. Make them interesting and more likely to be read with a story. Stories also provide context, links to more information and direct people to your call to action.
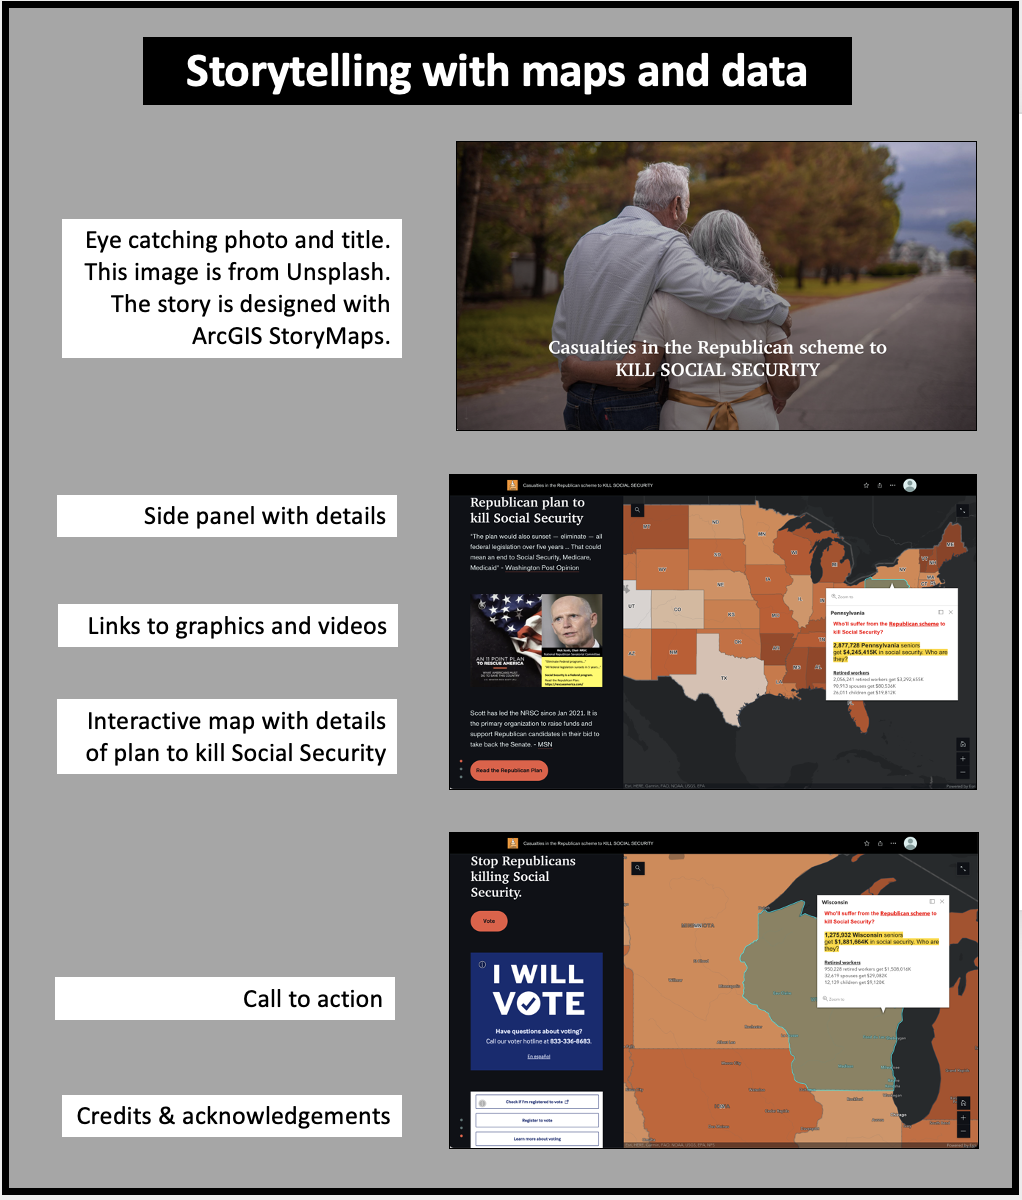
- Choose an appealing photo or video to attract people’s attention. I used a royalty free photo from Unsplash.
- This Story was created with the ArcGIS StoryMap app.
- Use a pyramid style for your story. Start simple and then add more details.
- Make it interactive so people can see for themselves how the Republican plan to kill Social Security will impact the state where they live.
- Provide links to more information. This StoryMap has links to the actual GOP Plan and articles about Rick Scott’s Medicare fraud history.
- Include videos to provide color and more context.
- Put in a call to action. Our message was that readers should vote for Democrats to stop Republicans from killing Social Security.
- Credit the sources you used such as the Social Security Administration and the Washington Post.
- Make it easy for readers to share your story. This StoryMap can be freely shared with this link or embedded in a web site with the code below.

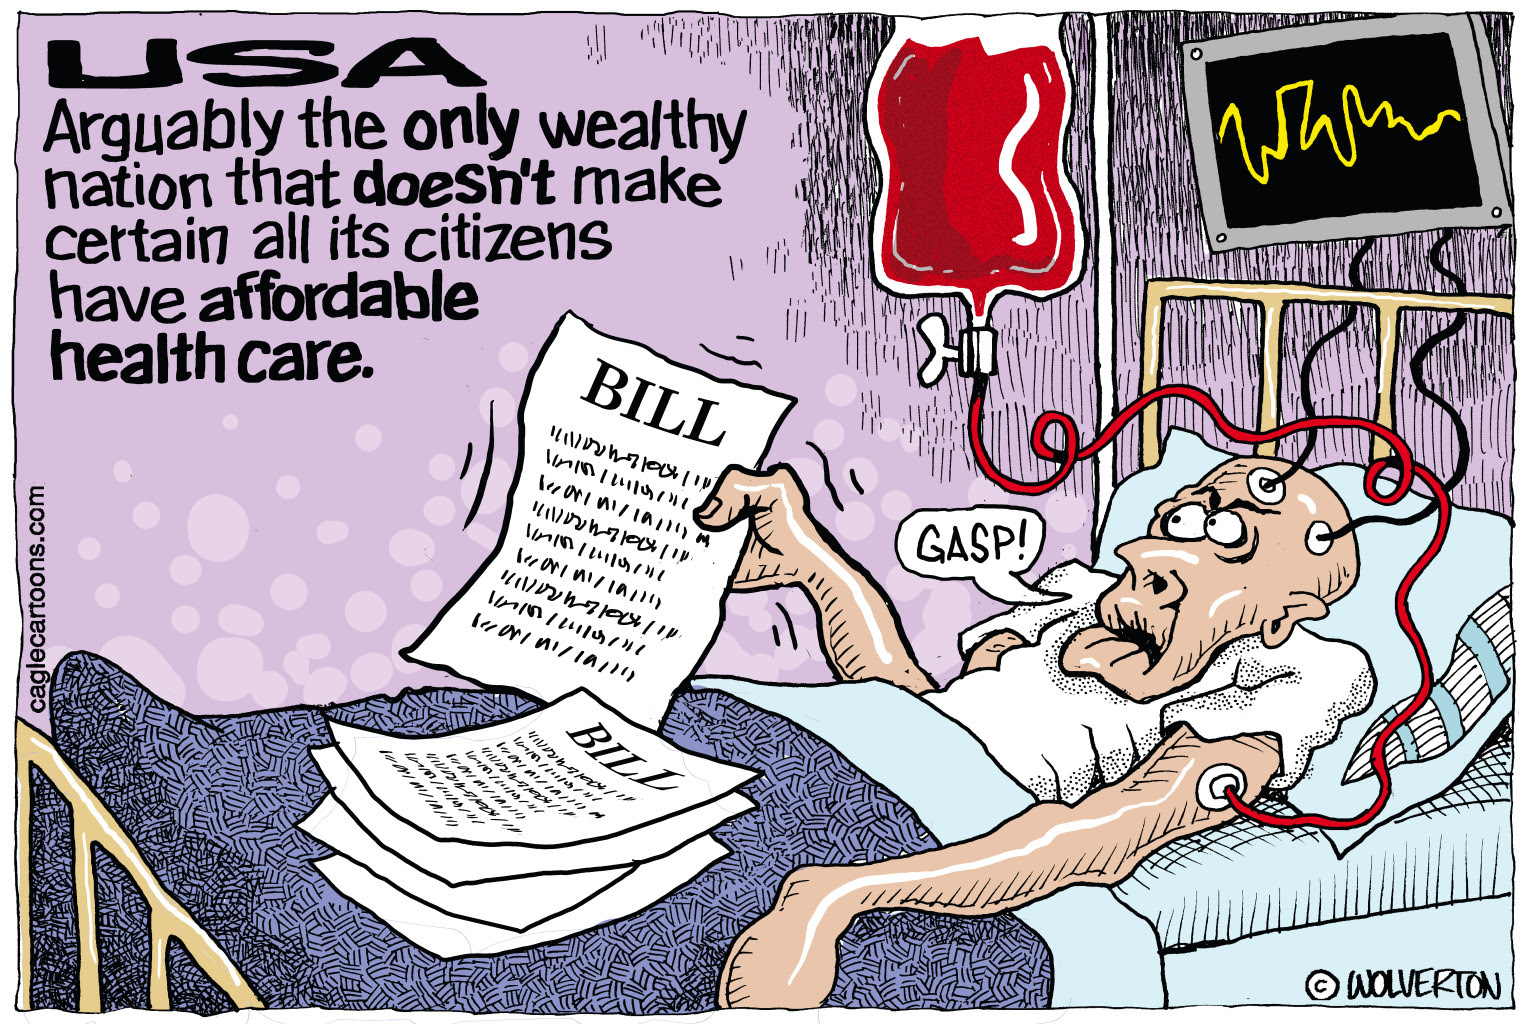
Use humor
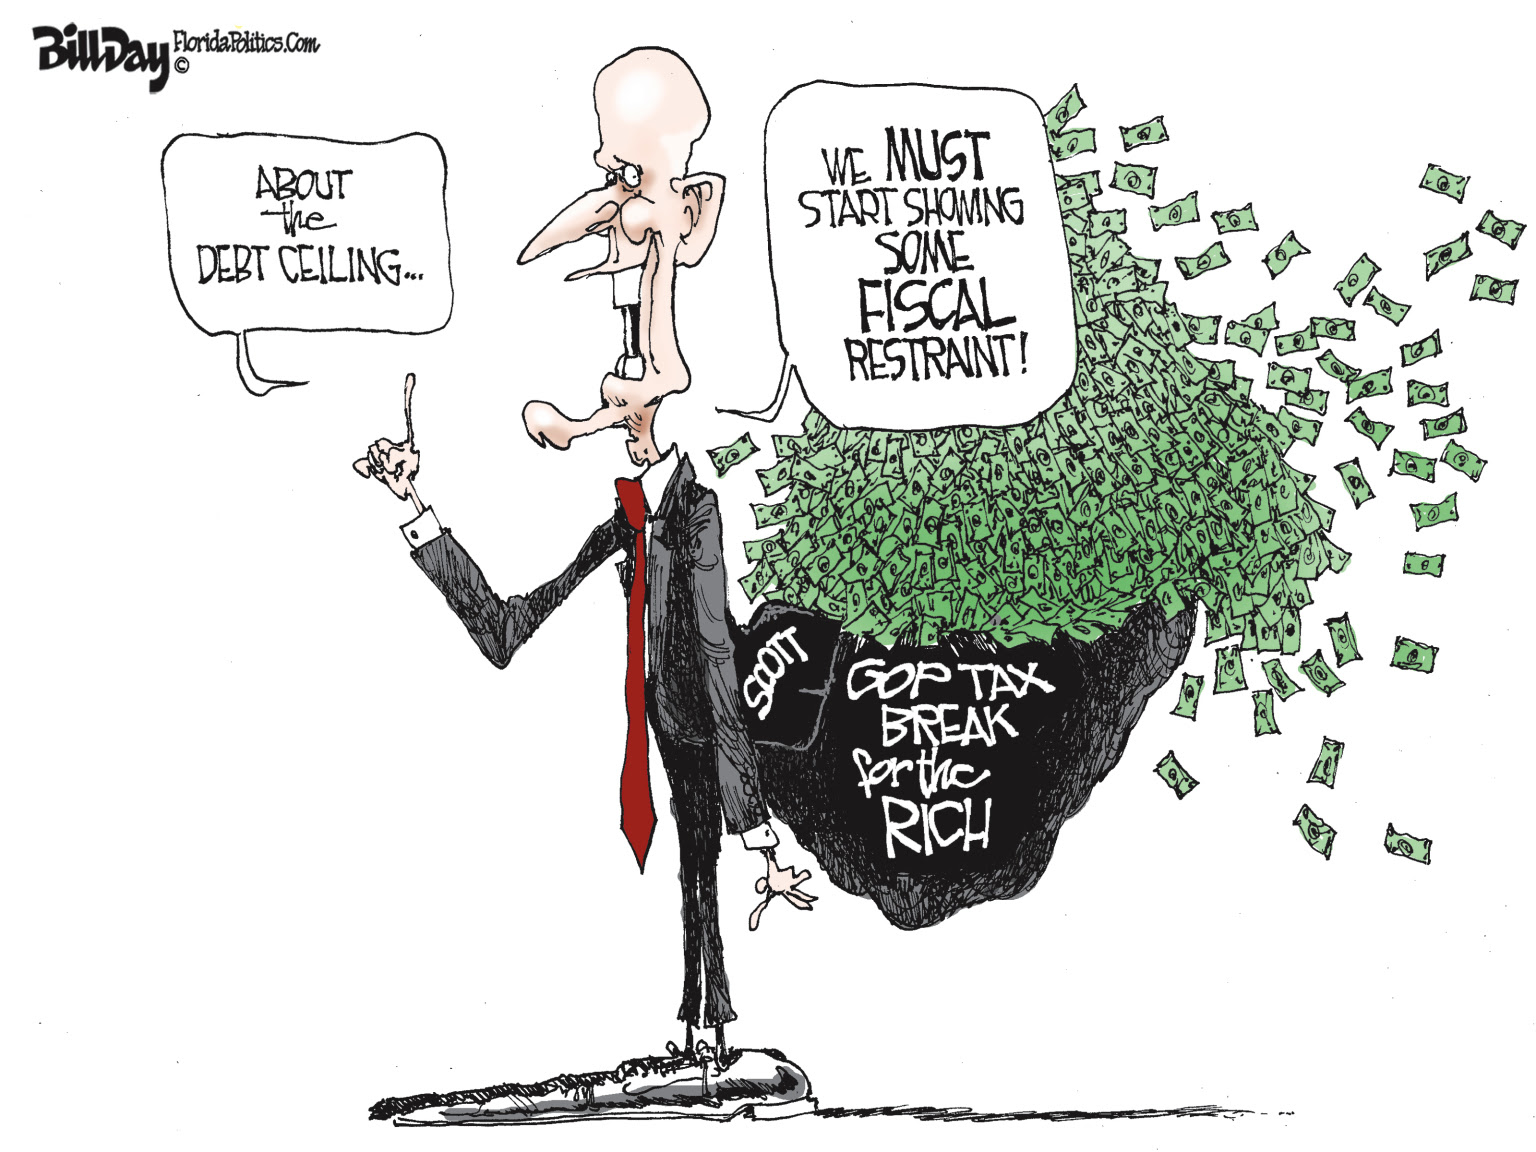
Use humor in your story. Cartoons are especially helpful as they distill a point into a picture that can be understood regardless of language, age or education level.
Republican hypocrisy in demanding tax cuts for the rich while denying basic benefits to needy seniors is rich. Especially by someone with a history of Medicare fraud. Call it out. “Ridicule is man’s most potent weapon.” There is no defense. It’s irrational. It’s infuriating.” Saul Alinsky in ‘Rules for Radicals‘
TakeAway: Elections matter! Vote for Democrats to protect your Social Security.
Deepak
DemLabs
Code to embed StoryMap in a website < iframe src=”https://storymaps.arcgis.com/stories/f1e6d52003e449f49d56ebdfe9ac73ef” width=”100%” height=”500px” frameborder=”0″ allowfullscreen allow=”geolocation”></iframe>
DISCLAIMER: ALTHOUGH THE DATA FOUND IN THIS BLOG AND INFOGRAPHIC HAS BEEN PRODUCED AND PROCESSED FROM SOURCES BELIEVED TO BE RELIABLE, NO WARRANTY EXPRESSED OR IMPLIED CAN BE MADE REGARDING THE ACCURACY, COMPLETENESS, LEGALITY OR RELIABILITY OF ANY SUCH INFORMATION. THIS DISCLAIMER APPLIES TO ANY USES OF THE INFORMATION WHETHER ISOLATED OR AGGREGATE USES THEREOF.
A little humor never hurt


Reposted from Democracy Labs with permission.