


Want better roads, safer bridges or faster internet? Invest in infrastructure.

Invest in the things that improve the lives of all Americans. Infrastructure.
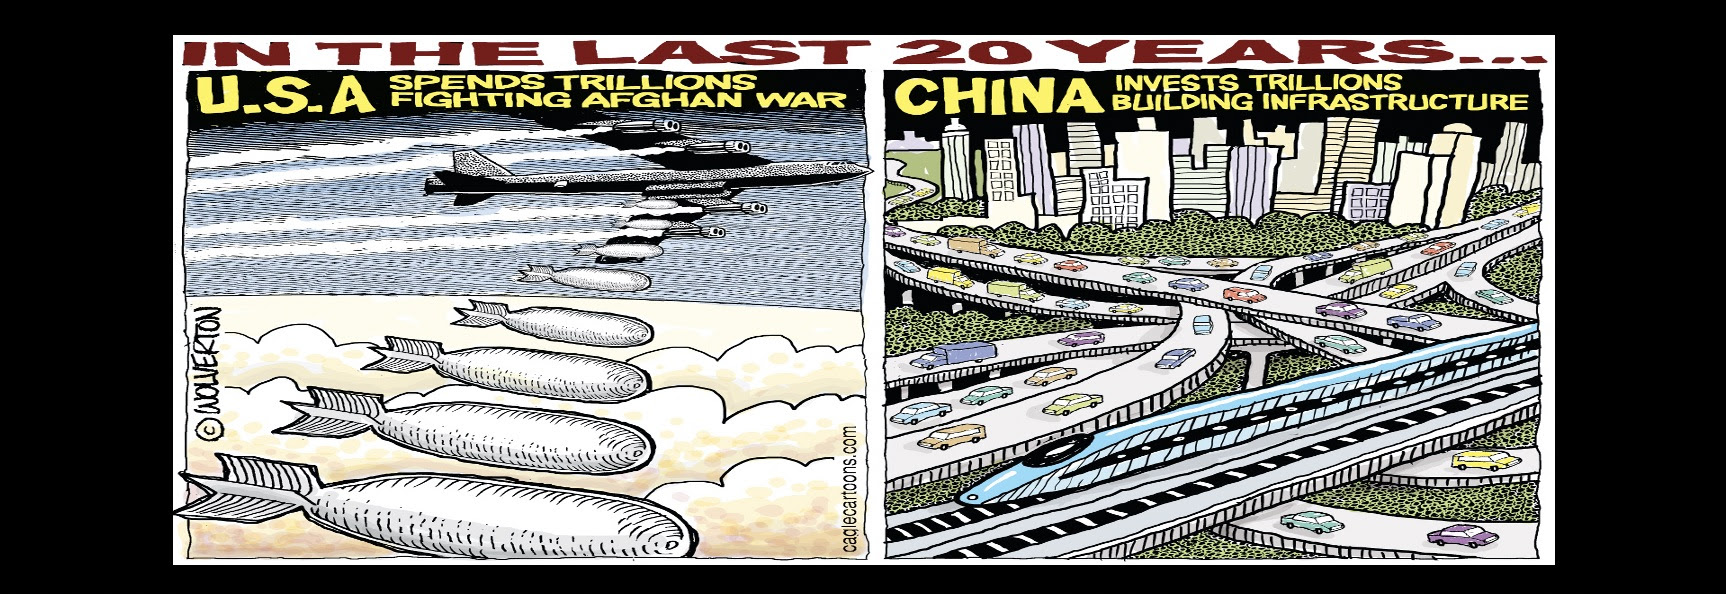
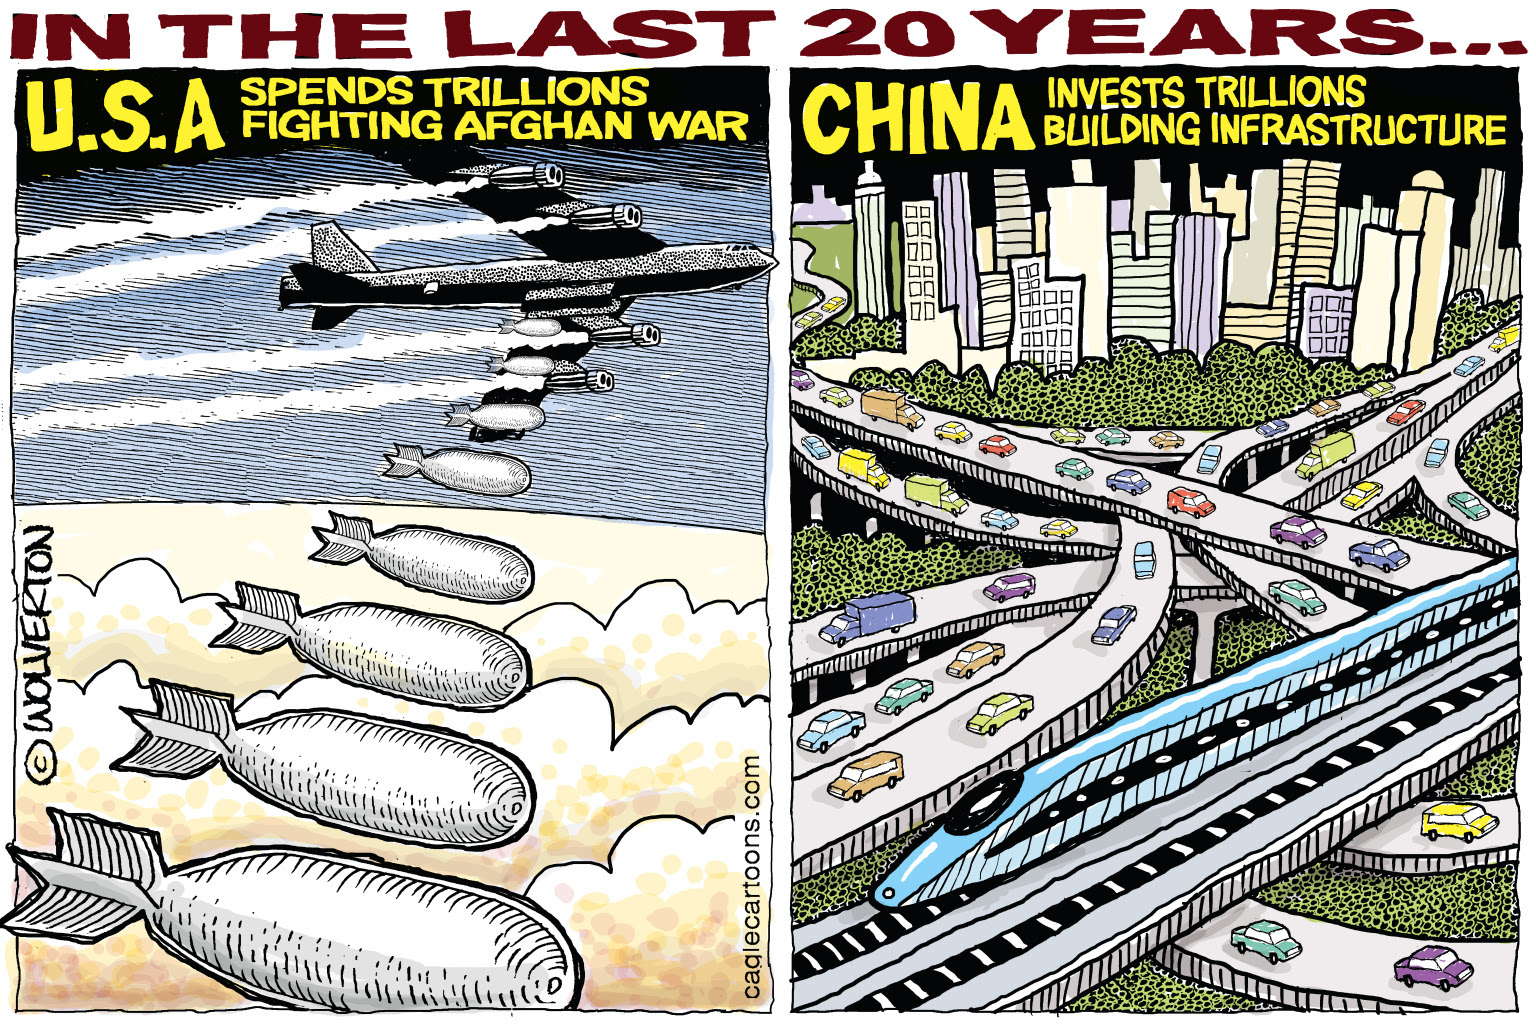
Republicans spend billions on bombs, but refuse to investing in fixing roads and bridges. They complain about the need for better education, but refuse to invest in building schools and broadband internet. What gives? Shouldn’t your tax dollars these Republicans are spending go to improve your life?
Talk is cheap. Infrastructure costs money.
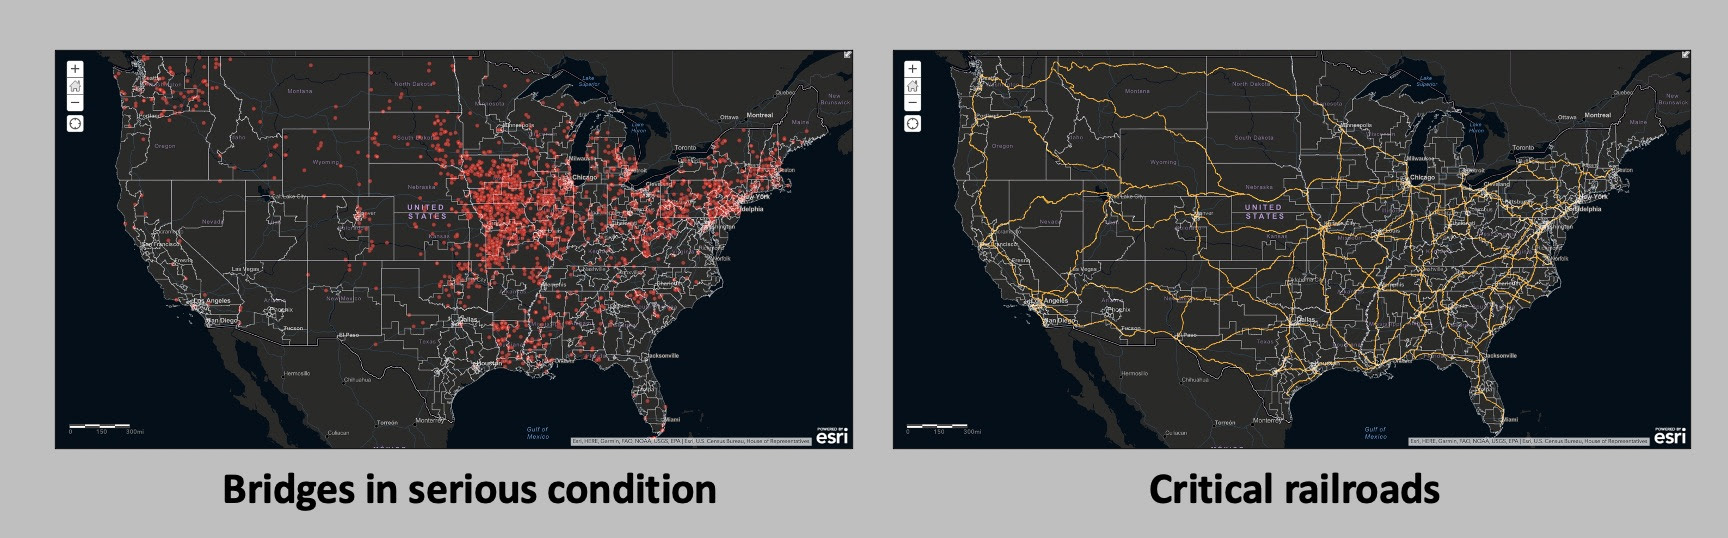
Better roads and safer bridges improve the supply chain. Faster internet helps us all. Where are bridges in urgent need of repair? Which communities lack internet access? Check this StoryMap to see how you benefit from investments in infrastructure. And who voted for the bill to invest in you.

Share this map freely with this link https://arcg.is/K4bO5
Share as a GIF https://media.giphy.com/media/jCE7hw1zRodASemqS6/source.gif
Embed it in a website with this code < iframe src=”https://storymaps.arcgis.com/stories/b25808d2c4674fee86a1683be80322b4?header” width=”100%” height=”500px” frameborder=”0″ allowfullscreen allow=”geolocation”></iframe>
Designing the Infrastructure StoryMap
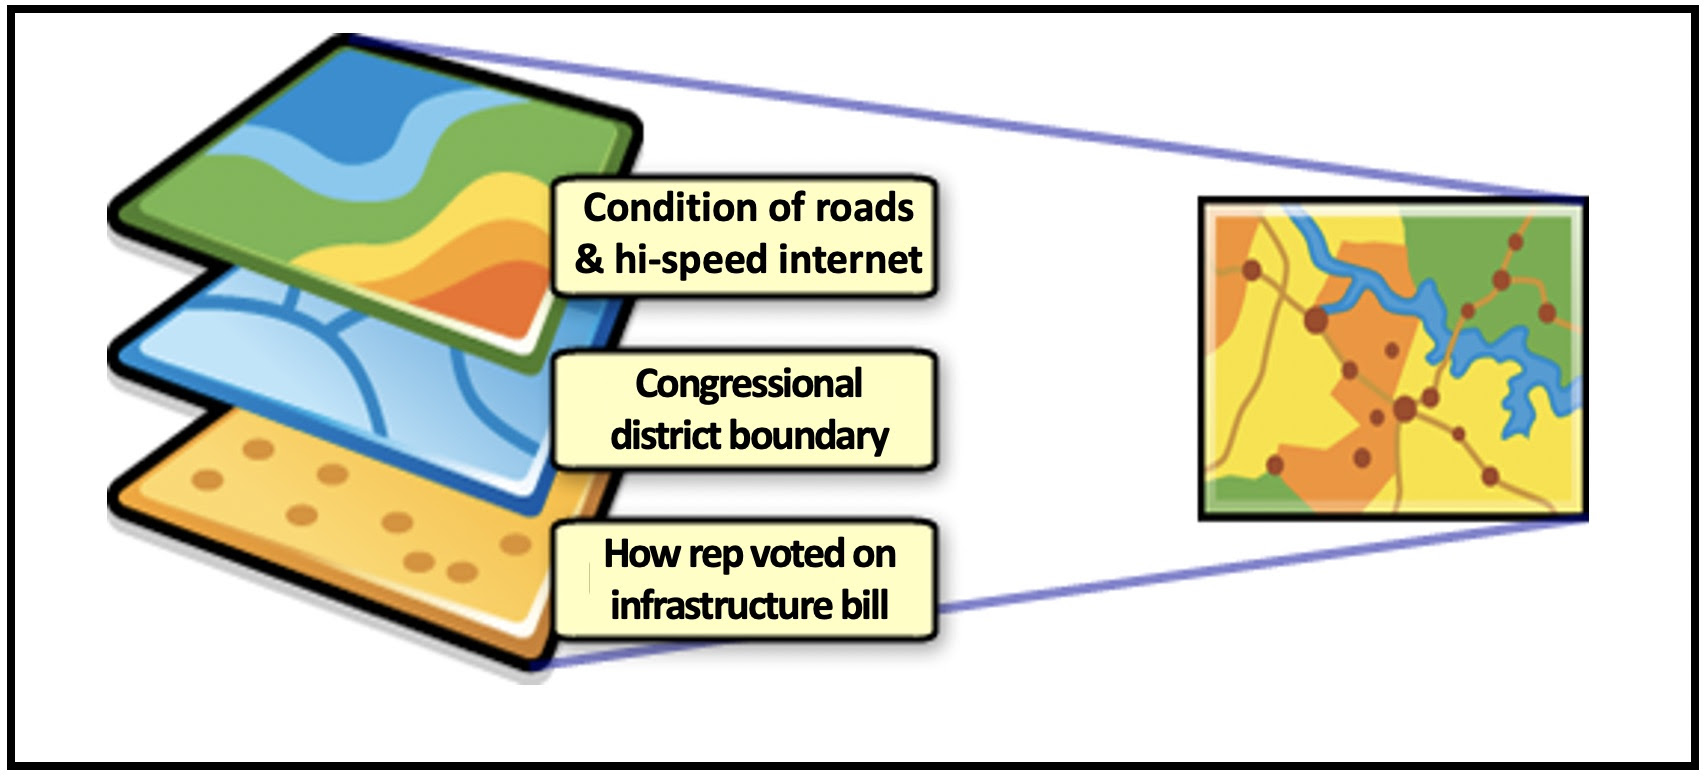
This StoryMap personalizes how the infrastructure bill will help the reader with better roads, bridges and faster internet. They can also quickly see how their Congressperson voted on the bill. Overlaying these map layers on the congressional district boundaries makes it easier to see if your congressperson is representing your interests – or just playing politics.

What is a map layer?
Different types of information is represented on a map as a ‘layer’. In this project the data layers are:
– Congressional district and how the rep for that area voted
– Bridges in ‘serious’ condition in need of improvements
– What are the vital railroads in a county and state
– How many people are lacking broadband internet access it an area
This StoryMaps used data layers from esri Living Atlas which can be displayed or hidden.
Such maps also make it easier to call out a Congress person who voted against the bill, but then claims credit for what it provides in the district.

Infrastructure bill
The $550 billion in new spending includes big boosts in funding for transportation, internet access, and clean drinking water, much of which will be distributed to states to fund regional projects.
- $110 billion for roads and bridges: to make them more structurally sound and repairing damage like potholes.
- $66 billion for passenger and freight rail: Modernize existing rail services and expand lines.
- $65 billion for expanding broadband access: Provide high-speed internet access to millions of Americans who don’t currently have it, funds for broadband in rural areas and on tribal lands along with vouchers to help low-income families afford internet access.
- $65 billion to update the electric grid: Improve the resiliency of the electric grid against wildfires and hurricanes and adde new power lines.
- $55 billion for water and wastewater: The measure tackles water quality with $15 billion to replace lead pipes, $10 billion to remove contaminants in drinking water, and over $20 billion for related projects.
- $39 billion for public transit: Repair existing public transit lines, modernize them, and make them easier to access. Make bus and rail fleets greener.
- $25 billion for airports: Upgrades air traffic control equipment, and to tackle airport repairs and maintenance.
- $17 billion for ports and waterways: Curb pollution near ports, and reduce congestion.
- $7.5 billion for electric vehicle chargers: Establish a robust nationwide network of electric vehicle chargers.
- $1 billion for reconnecting communities: Removing existing barriers and building new roads, highways, and bridges to connect diverse communities.
– VOX
Gov Track
“GovTrack.us is a project of Civic Impulse, LLC, a completely independent entity which is wholly owned by its operator and receives no funding in any form from outside organizations. They have no financers, sponsors, investors, or partners, nor do we have any affiliation or relationship (financial or otherwise) with any political party, government agency, or any other outside group or persons. They pay their operating costs through our advertising revenue (read their ad policy) and crowdfunding (support them on Patreon)”.Support Gov Track
TakeAway: Hold your elected official accountable for how they spend your tax dollars.
Deepak
DemLabs
Images


Reposted from Democracy Labs with permission